




The solar energy sector is now using AI to help move solar power to grid parity in markets worldwide through two complementary approaches.
Artificial intelligence (AI) is already present in our daily lives, from voice-enabled applications to automating trading decisions in the financial sector. In a study published in 2017, PWC estimated that AI could contribute as much as $15.7 trillion to the global economy by 2030. This demonstrates the high potential of this technology to lead to the transformation of Industry 4.0.
The global solar energy sector is using AI to bring solar power closer to grid parity in the market through two complementary approaches.
One is power generation and demand forecasting – Reducing the uncertainty in generation and grid power demand forecasts will enable more innovative operations by reducing unexpected savings and maximising renewable energy deployment.
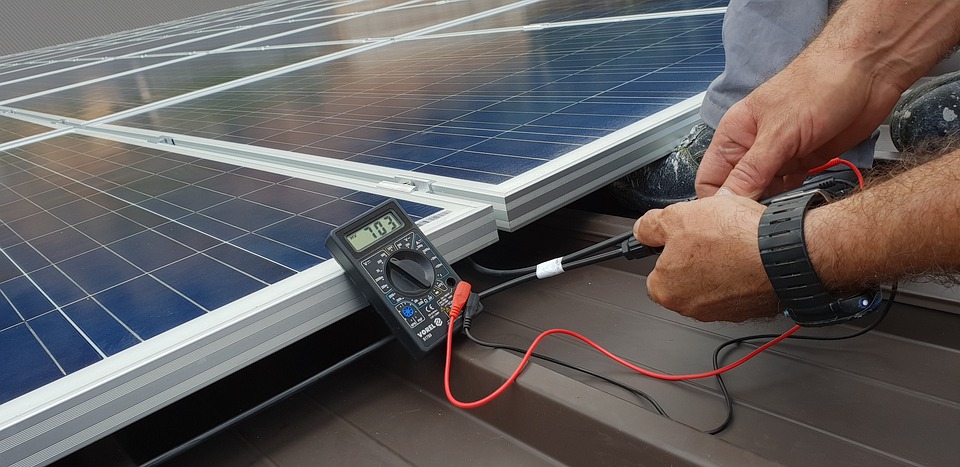
The second is optimizing the performance of the PV system. This is made possible by isolating faults throughout the PV system (inverters, DC subsystems, etc.). This approach aims not only to increase the production of photovoltaic systems but also to reduce operating and maintenance costs through early fault detection. It also identifies underperforming components that need repair or replacement.

In this blog, there are three main groups of modern methods for monitoring and diagnosing PV systems. (a) electrical methods based on direct measurement of electrical parameters; (b) AI Techniques. (c) Thermal Analysis. Mostly relevant for thermal images taken with aerial drones.
In electrical methods, the algorithms used to model, control, and predict power system performance often involve complex differential equations. This process requires enormous computer power and long-time requirements. However, another approach is to use AI techniques that can "learn" important information patterns and relationships in multidimensional information spaces such as Artificial Neural Networks, Genetic Algorithms, or Random Forests.
Several studies have demonstrated various applications of AI in the solar energy sector, thanks to the versatility and flexibility of machine learning (ML) algorithms. Some of these applications are incident detection by unsupervised learning or by comparing measured data with simulated electrical measurements. Another example is short-circuited fault detection in PV arrays using artificial neural networks (ANNs). A hierarchical situational awareness anomaly diagnostic method for automatically detecting the operating state of individual strings. Alternatively, predict pollution effects using Bayesian neural networks and polynomial regression.
Finally, the third thermal analysis approach can also be optimized using convolutional neural networks (CNN). CNNs have proven to be very efficient in classifying thermal images in medical applications. It can also be adapted to detect and classify incidents using thermal imagery, following a scheme like the one shown below.

To choose the best algorithm type for your model, you need to understand how ML algorithms work. For example, decision tree models form predictions based on multiple yes/no questions that depend on specific hyperparameters, whereas linear models assume linear relationships between variables. Furthermore, it is important to identify the essential nature of the system. In this case, the physical principle that connects power generation, irradiation, and temperature in a photovoltaic generator. This is important for the following reasons:
1. Model interpretation is often about what is the root cause of poor performance and which variables are more influential when there is a large discrepancy between predicted and measured data. help you decide whether to accept
2. The model should generalize well under similar conditions. For example, this study could include wind speed as an additional source of information for training the model. However, we don't want the model to give too much weight to this variable when making predictions. If for some reason it correlates with another related variable (like module temperature), it can happen, especially with very little data.
In this study, we use the one-diode model equation to model the behaviour of the PV array with the relationship:


Here I0 represents the saturation current of the module and IL is the light-generated current proportional to irradiance. Therefore, under normal operating conditions, the power generated can be expressed approximately proportional to the relevant variables of the dataset, irradiance (Rad), and module temperature (Tmod).

This relationship is shown in the following diagram. Here DC power is plotted against irradiance and colour is defined according to module temperature. It is worth noting that the DC power depends mainly on solar radiation, but the higher the module temperature, the lower the DC power, especially in the case of high solar radiation.

The next step is to train and tune the model by adding/subtracting some variables. See how they affect your results, analyze your limitations, and interpret your results. The following figure shows the energy yield on a sunny day (left), the power insolation curve (right), and the forecast by three different models (two linear models and one XGBoost).


It should be noted that the data used to train these models have been processed to remove discrepancies, outliers, or other occurrences present in PV plants. Otherwise, you'll end up training your model with the wrong ideal operating point.
The first linear model doesn't do a bad job of predicting DC power, but the second included module temperature doesn't seem very useful, especially in the morning. This difference can be caused by other components such as – A wire or inverter that controls the maximum power point (MPP) of the IV curve and affects the power generation.
However, thanks to the wide variety of ML models, it is also possible to optimize the best model for the problem. His third model in this case is the XGBoost. This is a gradient-boosting machine algorithm and it seems to be able to learn the power limit at high irradiance due to the maximum nominal power of the inverter.
The following table summarizes the root mean square error (RMSE) for each model, one of the most common measures used to measure the performance of regression models.

Models can be used to predict energy production, compare it with actual data, look for energy losses, and characterize them by answering questions such as
This could be a sudden break in the string or long-term deterioration of the module.
Does the difference affect current only or also voltage? For example, pollution can only reduce the amount of light reaching a solar cell, thus reducing the photogenerated current, but PIDs can also have a strong effect on the voltage.
Are the energy losses constant throughout the day or only in the morning and afternoon? Are they related to the module temperature?
Do these differences also show up in other elements of the PV system? For example, inverter clipping can limit the power production of multiple strings.
The following figure shows an example of power loss.

The example presented here demonstrates how ML techniques can be applied to detect energy loss in PV systems by analyzing the nature of the problem, training a model from weather data, and recognizing the limitations in predicting the data. It's intended to show the basic approach to use.
However, in a real application, using the ML model would require other steps, so they are omitted here for simplicity. These are procedures like data quality analysis (data cleaning, imputation of missing or constant values, outliers). Feature engineering (principal component analysis, linear discriminant analysis, etc.); model selection, optimization, and validation. Furthermore, multiple algorithms are combined to ensure accurate and reliable results for fault detection in photovoltaic systems.
You can also read: When Renewable Energy Meets Artificial Intelligence & Machine Learning
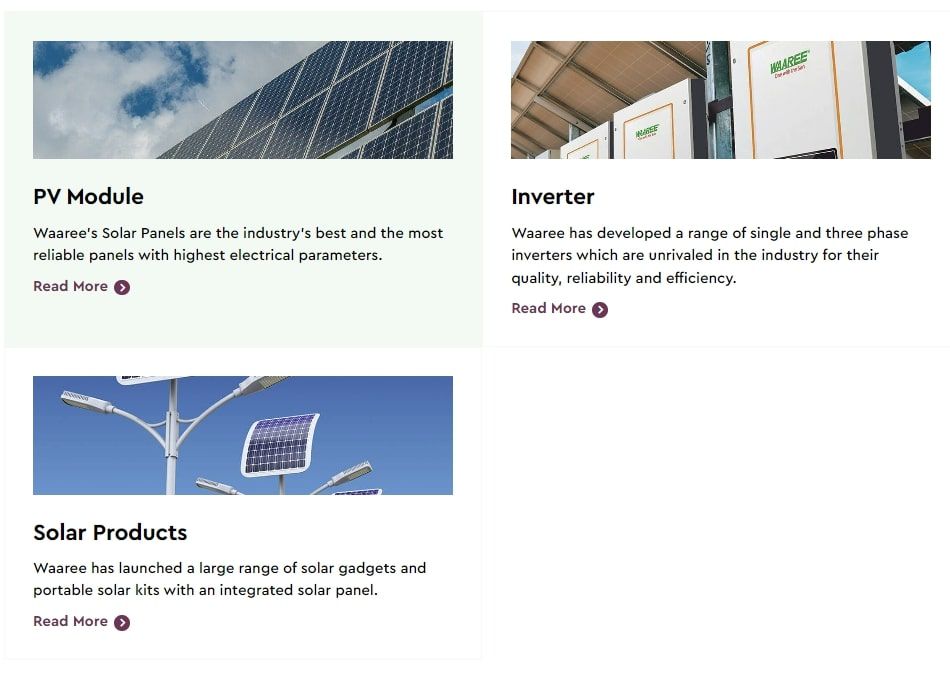
PRODUCTS OFFERED
Waaree Energies Ltd. is the flagship company of Waaree Group, founded in 1989 with headquarters in Mumbai, India. It has India's largest Solar panel manufacturing capacity of 5GWs at its plants in Surat and Umbergaon in Gujarat. Waaree Energies is amongst the top players in India in Solar Panel Manufacturing, EPC Services, Project Development, Rooftop Solutions, and Solar Water Pumps and is also an Independent Power Producer. Waaree has its presence in over 380 locations nationally and 20 countries internationally. Step on to your cleaner journey by contacting us at 18002121321 or mail us at waaree@waaree.com